Subscribe
To subscribe select the service(s) you want by clicking on the boxes below, then click on the checkout link.
Multi-user discounts: Please note that subscriptions are for single users. For organisations who wish to obtain multi-user or professional licences please call to discuss your requirements.
$ 0
US Stocks Service
We have been delivering our stockmarket research for over 20 years in order to highlight suitable trading and investment ideas for clients.
Daily Market Report & Trading Ideas
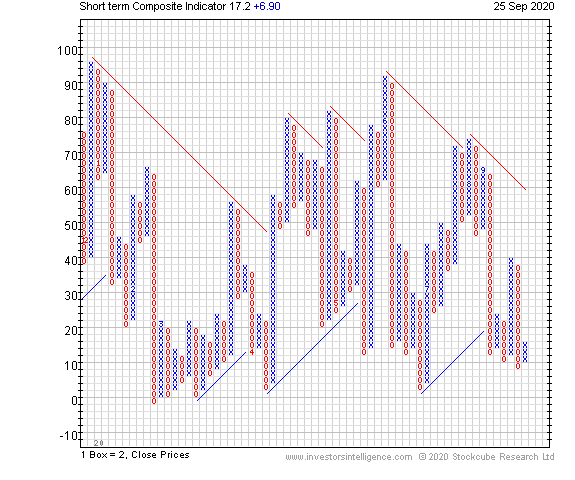
The Market Report is delivered each morning (before the open) and provides market timing, sector and stock ideas. We display relevant charts and technical commentary. These ideas are reflected in model portfolios which include large cap, mid cap and small cap portfolios, together with a bear portfolio. We utilise our short term composite indicator to assist in short term market timing

The Short term Composite Indicator was developed by Investors Intelligence during the 1960's, this is a valuable tool for short term market timing; when the indicator registers a reading above 70 the general index has become overbought and when registering below 30 is become oversold. The indicator is most useful when registering extreme readings following major moves, which sometimes register readings of 100% on the upside and 0% on the downside.
US Market Timing
"This is an exceptional service and should be in every traders toolbox. Thank you for the great service!" C.C., USA
The market Timing Service analyses various indicators to determine the likely strength or otherwise of the general market. Please see example provided of the success that the combination of market timing indicators has had in recent volatile markets. The service is designed to help investors in their analysis of the general level of exposure they should have to the market, rather than just rely on a “Buy and Hold” strategy
The various studies try to anticipate rather than follow trends: our analysis does not just rely on the study of current market trends. Our techniques are contrarian studies and therefore lead to early and timely signals of market trend change.
We provide daily research modules: the daily modular format allows us not only to report any significant market timing signals, but to analyze the results of our disciplines in daily rotation, in a clear and logical manner. These dailies are summarized in the Weekly review We utilise our short term composite indicator to assist in short term market timing
- Buying/Selling Climaxes: large numbers of Buying or Selling reversal signals across the market frequently provide an early indication of a change in trend for the market as a whole.
- Industry Group Analysis: by studying the trend breadth in the underlying industry groups, we can understand whether Industry readings are suggesting either sector shifts in the market or telling in aggregate of likely Index trend change
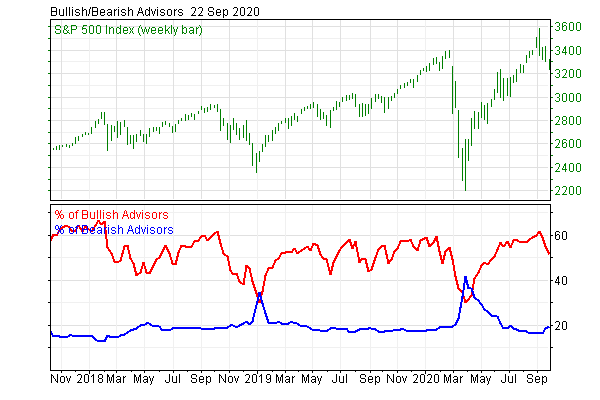
- Advisors’ Sentiment Report: this survey has been widely adopted by the investment community as a contrary indicator and is followed closely by the financial media. Since its inception in 1963, our indicator has had a consistent record for predicting the major market turning points. It is a contrarian indicator looking for either extreme Bullish or extreme Bearish readings which tend to coincide with tops or bottoms in the market
- Sector Analysis: we identify sector trends and potential rotations between sectors. This analysis looks to identify leadership and also determine the general health of a market.
- The Weekly Review: each week we draw together the findings from the research modules and suggest a market outlook for the week ahead and possibly the longer term.
- This service includes online access to charts, indicators and automated point and figure signals
UK Stock Service
The UK Daily Hotline is delivered each morning and provides actionable ideas on highcap stocks. We display relevant charts and technical commentary. We also comment on Index trends and our ideas are reflected in a model portfolio.
Chart of the day
We focus on a particular stock which is of the strongest technical interest to subscribers. Both long and short-sides trades are identified.
All stocks, indices, sectors and analysis on the UK market are available to subscribers on www.investorsintelligence.com
Asia Stocks Service
Asia
Stock Coverage: component stocks within the Australia AS50, Hong Kong Hang Seng, Korea Kospi 100, Singapore STI 35 and Taiwan 50 indices.
Weekly Market Statistics: delivered after the market’s close on Friday covering index trends, index/industry breadth, p&f stock signals generated over the week and buying/selling climaxes.

Global Macro Trends
Each day we evaluate the most important macro trends. We analyse selected index, ETFs and futures instruments. We display relevant charts and technical commentary
We illustrate our recommendations via a model portfolio which gives a clear outline of our asset allocation preferences across asset classes.
Online access
As a subscriber, you will have access to the daily updated ETF charts on the Investorsintelligence.com website. Our charting engine allows you to apply technical studies including point & figure, candlestick, moving averages and momentum. You can save your fund selections in watch lists. You will be able to view the current ETF Review and archived copies.
All stocks, indices, sectors and analysis are available to subscribers on www.investorsintelligence.com
Advisors Sentiment
US Advisors' Sentiment Report - Signals when you need them – near important market tops and bottoms

The Advisors’ Sentiment Report… heralding major market moves since 1963
This survey has been widely adopted by the investment community as a contrarian indicator and is followed closely by the financial media. Since its inception in 1963, our indicator has a consistent record for predicting the major market turning points.
Surveying a broad assembly of respected views
We study over a hundred independent market newsletters and assess each author’s current stance on the market: bullish, bearish or correction. Since we have had just four editors since inception, there has been a consistent approach to determining each advisors stance and his prior viewpoint.
Six decades of data to set our precedent
Our weekly sentiment data runs consistently back to the 1960’s. Current readings are put into context against historic precedents.
When the survey was developed by our founder, AW Cohen, he originally expected that the best time to be long the market was when most advisors were bullish. This proved to be far from the case – a majority of advisors and commentators were almost always wrong at market turning points. Quite simply, professional advisors are just as susceptible to market emotions as individual investors – they become far too greedy at the top of trends and far too fearful near the bottom.
A contrary indicator…but only at extremes
We don’t necessarily take a contrarian view to the newsletter writers in our survey. A large part of the time our sentiment readings remain neutral. We consider the norm to be 45% bulls, 35% bears and 20% neutral. However, we do pay attention to extreme readings in both bulls and bears and also to historically significant runs of more bulls than bears. To summarize, advisors are only wrong when you get too many of them start thinking the same thing.
Featured in the international financial press
The analysis and data regularly feature in the international financial press as a key indicator of market reversion.
Examples of these articles can be found on Barrons, NY Times, and Investor's Business Daily.
Read what CNBC said about the biggest switch in sentiment for 7 years.