Volume studies
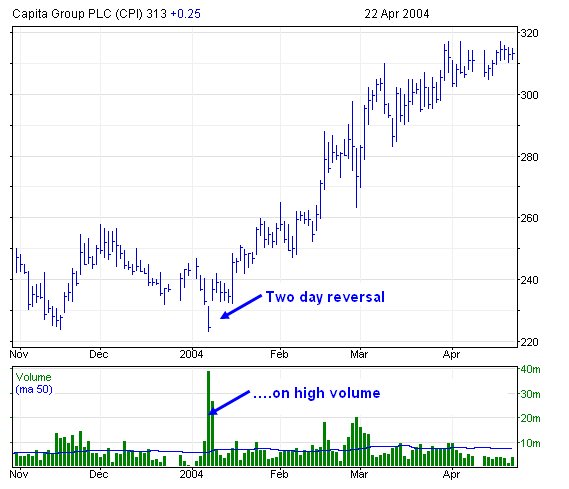
Changes in trend are often associated with sudden increases in trading volume and it is therefore well worth monitoring volume, particularly when a stock experiences a key day reversal.
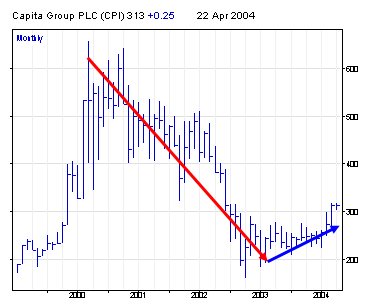
Let's take a look at Capita, the UK services stock. Since 2000, it had been in a steep downtrend falling from 600p to just 1/3 of this value at 200p.
In hindsight, we know that the first few months of 2003 provided a great buying opportunity for most stocks, but could analysis of the volume have helped us back then?
We have already discussed the concept of key reversals. The chart below shows the two-day reversal back in January 2004. This signal was confirmed by the large increase in trading volume at that time. Note the volume histogram has a moving average line to isolate days of above-average volume.